A term paper for ENVS411 Spatial Planning Challenges. It discusses Arlington County’s strategy for concentrating dense development along the Rosslyn to Ballston Metro corridor, and the effect on transport choices by residents. This report received a 72, distinction. Written in December 2016.
1. Introduction
Providing alternatives to ownership of private vehicles is necessary to encourage sustainable transport choices, but planners must also advance a built environment that enables these alternatives to thrive and attract would-be drivers (Speck, 2012) (Newman and Kenworthy, 1999). One framework for planners is transit-oriented development (TOD), a spatial planning approach that proponents argue can lead to more sustainable transport choices (e.g., metro, walking) by permitting dense, mixed use development around high-capacity and frequent public transport (Calthorpe, 1993) (Bannister, 1999), (Dittmar et al, 2004). To assess this proposition, this paper investigates the experience of Arlington County, Virginia, an immediate suburb of Washington, DC and a pioneer of TOD principles before the concept had a name.
TOD comes from Peter Calthorpe, an American planner, who coined the phrase in 1993. Calthorpe identified seven principles that underpin TOD, which include dense development, protection of animal habitats, and walkable streets (Figure 1.1) (Calthorpe, 1993). This paper considers TOD to be a spatial planning approach because Calthorpe’s principles encompass the economic, environmental, and social dimensions that the Royal Town Planning Institute (2014) notes are fundamental to spatial planning, and which planners can address by promoting sustainable land use and development.
Figure 1.1: The Seven Principles of TOD
|
Source: Calthorpe, P. (1993). The next American metropolis: Ecology, community, and the American dream. New York: Princeton Architectural Press, the table lists the seven principles for TOD identified by Calthorpe.
Although Arlington’s intervention predates TOD, the county is an appropriate case study, as it serves as one of the ‘first-ring suburbs with their often vacant industrial zones and moribund retail corridors’ that Calthorpe identified as ideal starting points for TOD (2010, p. 87). In particular, Arlington attempted to leverage investment in a new metro system to revitalise a struggling commercial corridor (Leach, 2004) (Kraft, 2013). This paper now turns to the specifics of that intervention and the outcomes.
2. The Intervention
In the 1960s, Arlington faced population loss as residents left for more distant suburbs, with planned motorways threatening to accelerate (and facilitate) their departure (Dittmar et al, 2004). Arlington had an opportunity to reverse the trend after significant grassroots opposition to the motorways—with protestors ‘lay[ing] down in the path of bulldozers and [tying] themselves to trees—convinced the federal government to rededicate funds to instead build a metro system (Speck, 2012, p. 79) (Schrag, 2014).
The system would be a hybrid underground and commuter railway, known today simply as Metro (Schrag, 2014). Arlington would have 10 stations, five of which would be near a three-mile, failing commercial corridor stretching from the neighbourhoods of Rosslyn to Ballston (RB) in the northern part of the county (Schrag, 2014). However, because Metro was primarily a replacement for the cancelled motorways, most stations outside of DC would feature large car parks to collect commuters headed into the city (Dittmar et al, 2004). In addition, to conserve resources, suburban Metro lines would run down the median of existing motorways (Ross, 2014). Although this alignment would both enable above-ground rails and avoid needing to purchase new right-of-ways from existing landowners along the route, the final product would negate TOD (Ross, 2014).
Instead, Arlington leadership spent an additional $100 million—a relatively small sum—to divert the portion of the orange line[1] by the RB corridor underneath Wilson Boulevard (Calthorpe, 2010). The decision did not guarantee TOD, as some residents organised to advocate for preserving low-density neighbourhoods near the corridor by planning for park-and-rides at each station (Leach, 2004) (Schrag, 2014). Listening to their concerns, the county prepared a General Land Use Plan (GLUP) that would restrict highest densities to a walkable radius of each station (0.25—0.5 miles) (Figure 2.1) (Arlington County, 2012).
Figure 2.1: Densities Permitted Under the GLUP in the RB Corridor
| By-Right | Site Plan | Outcome |
| 1.5 Floor Area Ratio[2] | 3.8—10 Floor Area Ratio | 153.3—566.7% change |
| 35—45-foot height | 100—300-foot height | 122.2—566.7% change |
| 4 parking spaces/1,000 square feet | 2 parking spaces/1,000 square feet | -50% change |
Source: Arlington County. (2012). 40 years of smart growth: Arlington County’s experience with transit oriented development in the Rosslyn-Ballston metro corridor, this table demonstrates the significant opportunity for developers if they agree to the site planning process.
The GLUP had several provisions to ensure development within the station radii aligned with the county’s objectives. In particular, developers could only build to the highest densities at sites closest to each station, with building heights decreasing as sites neared existing neighbourhoods (Arlington County, 2012) (Figure 2.2). This approach aligns with Dittmar et al who argued that TOD must match the ‘scale of the adjacent community’ (2004, p. 4). In addition, Arlington treated the eastern and western ends differently, permitting the highest densities in Rosslyn and Ballston, respectively, because the county co-located bus hubs at each station that could accommodate additional transit users (Schrag, 2014).
At any site, developers did not have access to higher densities by-right, but had to submit to a site plan review by county planners (Arlington County, 2012). To facilitate walkability, developers who received approval for their site plan needed to invest in streetscape and other area improvements (Arlington County, 2012). In addition, to encourage mixed uses, the county required developers to build residential units first to take advantage of higher densities for potentially more lucrative commercial development (Leach, 2004). In return, developers earned the right to build to higher densities, with fewer parking spaces per square feet. Fewer spaces is both a benefit to Arlington—which wanted to encourage people to take public transport, and the developer, which could avoid the often exorbitant cost of building parking spaces in urban environments (Speck, 2012). Figure 2.2 shows the initial GLUP map for the corridor, with the future Metro stations denoted by arrows.
Figure 2.2: GLUP Map for the RB Corridor, 1961
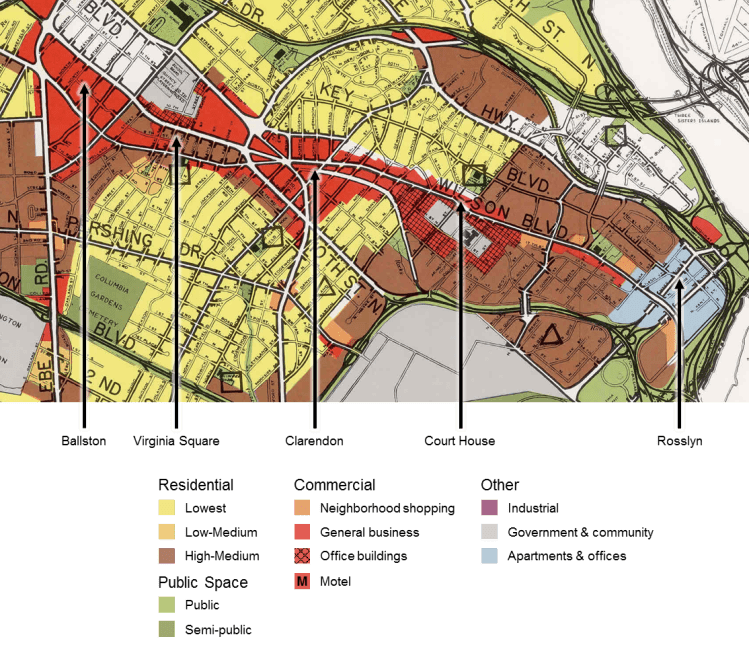
Source: adapted from Arlington County. (1961). General land use plan, the map shows the land uses permitted in the five development areas of the RB corridor and the locations of the future Metro stations.
Compared to later iterations, the first map is fairly basic. Still, dark browns, signalling higher residential density, and reds, indicating office buildings and businesses, highlight the corridor. In contrast, shades of orange and yellow signify low-density residential development in the areas just beyond the radii for each station. In 1979, the five stations at Rosslyn, Courthouse, Clarendon, Virginia Square, and Ballston opened. During the subsequent decades, Arlington’s decision to invest in these underground stations and encircle them with dense development has led to tremendous results.
3. Results
Arlington has released 12 updates to the GLUP, with the most recent map issued in 2014 (Figure 3.1) (Arlington County, 2016c). The current map includes several designations absent from the original one, including office-apartment-hotel (introduced in 1979) and mixed use (1983) (Arlington County, 2016d). Although the colours have changed, the dense corridor and low density neighbourhoods outside the station areas are still visible. The mosaic shows a diversity of permitted uses, and the development figures demonstrate that the GLUPs have not simply produced pretty maps.
Figure 3.1: GLUP Map for the RB Corridor, 2014
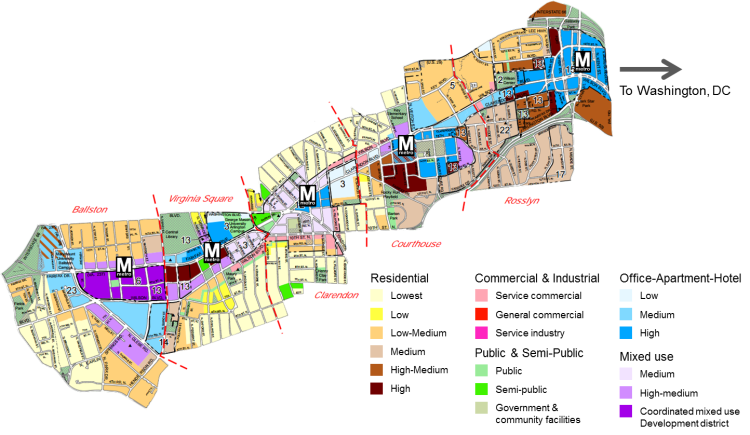
Source: adapted from Arlington County. (2016c). General land use plan map, the map shows the land uses permitted in the five development areas of the RB corridor.
From 1970 to 2016, the RB corridor had a net increase of over 17.1 million square feet of office space, 2.4 million square feet of retail space, and 25,100 residential units (Arlington County, 2012 and 2016b). Calthorpe (2010) determined that Arlington’s $100 million additional investment led to $8.8 billion in private investment. In addition, residential density averages 86 persons/hectare compared to 32 persons/hectare elsewhere (Arlington County, 2014). Despite the increased density, from 1996 to 2011/12 traffic counts fell 23% along Wilson Boulevard (Merchant, 2014). Falling vehicle traffic is not a universal good, as the former traffic commissioner for New York City has noted that ‘places with a lot of congestion are economically vibrant’ because people want to and do visit them (Schwartz, 2015). In this case, traffic did not decline because the corridor was no longer worth visiting, but likely because people were taking alternate modes. Indeed, during the same period, all public transport ridership in Arlington had increased by almost 35% (Merchant, 2014).
For additional transport data specific to the RB corridor, this paper turns to the U.S. Census Bureau’s American Communities Survey, which includes questions on transport choices at the census tract[3] level. This grain enables comparisons between residents of the RB corridor and people living elsewhere. Accordingly, four analyses using the survey data were conducted to explore this question. To avoid fluctuations that might occur in a single year, the most recent five-year estimates from the survey were used, covering the period from 2010—2014.
Using GIS software, the first analysis (Figure 3.2) plots the percentage of households that do not own a vehicle and the 10 Arlington Metro stations. The black circle around each station represents a 0.5-mile buffer, which TOD proponents argue is the distance that most individuals are willing to walk (Montgomery, 2013). The map shows that relatively high percentages of residents along the RB corridor, highlighted by the red dot metro stations, do not own a vehicle. A few other areas might appear to undermine the link between development along the corridor and vehicle ownership, but they are understandable with more information.
Figure 3.2: Households Without a Vehicle in Arlington, 2010-2014
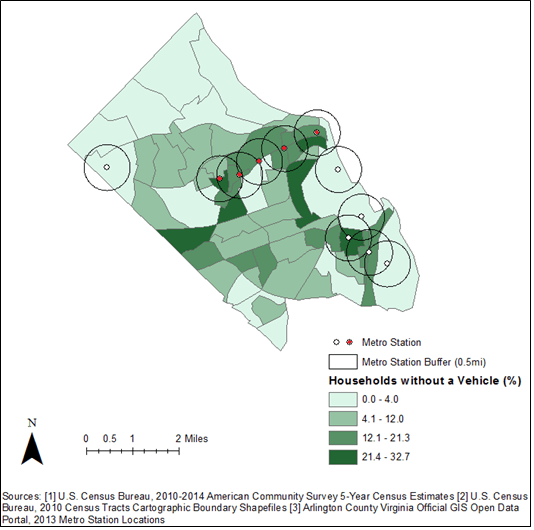
In the U.S., income is strongly associated with vehicle ownership (Newman and Kenworthy, 1999). Unsurprisingly, the dark green, triangular census tract—the Glencarlyn Park neighbourhood—in the mid-west part of the county has a high percentage of households without a vehicle because nearly 74% of households in the neighbourhood are below the poverty line (City-Data, 2013). The RB corridor is an exception, as only 2—13% of households are below the poverty line (highest in Rosslyn) (City-Data, 2013). Income is also high. As a whole, Arlington is today one of the wealthiest counties in the U.S. by median household income, and aside from Rosslyn, the areas by the RB corridor have higher median incomes than the rest of the county (Weaver, 2011) (Van Riper, 2014). Despite these higher incomes, vehicle ownership is still low. Newman and Kenworthy would likely credit Metro. They concluded that if ‘urban development is well integrated with the transit system, then a city will generally experience relatively high transit ridership, even if it is very wealthy and can afford high car ownership’ (Newman and Kenworthy, 1999, p.162).
On Arlington’s eastern side, three stations are in areas with high vehicle ownership. However, this result is not surprising because these areas do not meet Newman and Kenworthy’s criteria. From north to south these stations are at Arlington National Cemetery, the Pentagon, and Ronald Regan National Airport, each disconnected from the surrounding area by highways and surface parking lots. The final outlier is the dark green, sword-shaped census tract in the eastern part of the county. The boundaries for this tract are the grounds of Fort Myer, an active military base, so a different dynamic is at play compared to the rest of Arlington.
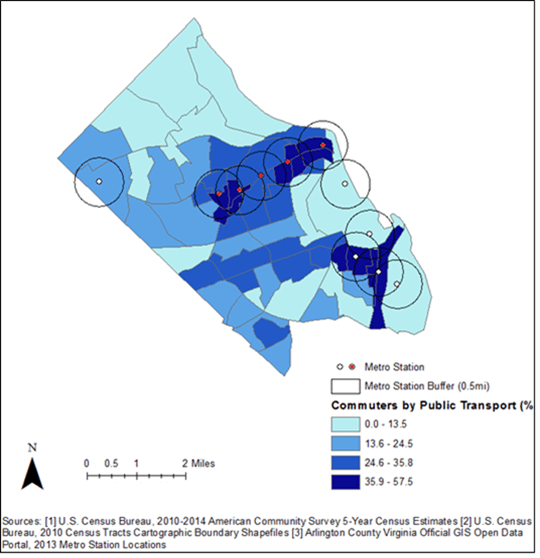
Vehicle ownership reflects only one element of sustainable transport, so the second analysis presents the percentage of residents who commute to work by public transport (Figure 3.3). In an even clearer pattern than the first analysis, the map shows notably higher percentages of RB corridor residents commuting by public transport, with the darkest blues by each station. South of the corridor, an east-west set of census tracts also have fairly high percentages of commuters taking public transport, which may be surprising since no Metro stations are along the route. However, these tracts surround Columbia Pike, a street served by buses transporting 16,000 daily riders (Sullivan, 2013).
Figure 3.3: Residents Who Commute by Public Transit in Arlington, 2010-2014
The emphasis on walkability and mixed uses indicates that residents in TOD areas should also be able to live near and walk to work. Accordingly, the third analysis shows the percentage of residents who walk to work (Figure 3.4). Although these percentages are not huge, they demonstrate the clearest pattern of the three maps, with the darkest oranges along the corridor. Notably, the Columbia Pike corridor is not a dark orange in this map, nor is the Glencarlyn Park neighbourhood. Understandably, a high percentage of soldiers living on Fort Myer also walk to work on the base.
Figure 3.4: Arlington Residents Who Walk to Work, 2010-2014
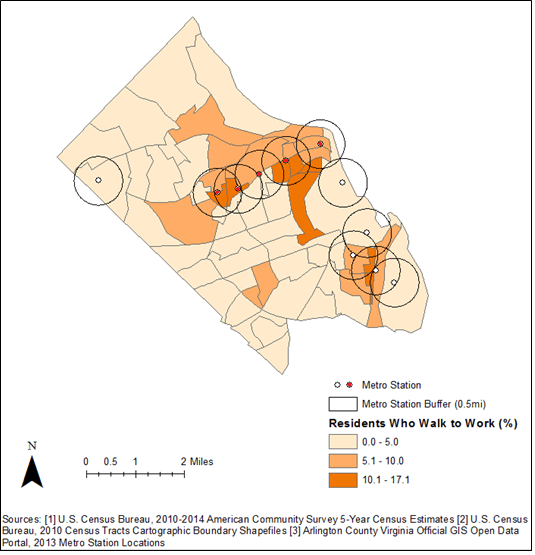
Each map is helpful for showing that residents along the RB corridor are less likely to own a vehicle and more likely to commute to work by public transport or walking compared to the rest of the county. These results align with the expectations for TOD. A final analysis using the American Community Survey data was completed to see if the pattern holds when comparing the corridor to the rest of Virginia and the U.S. as a whole (Figure 3). For the purposes of this analysis, the RB corridor includes data from the 22 census tracts that intersect with the 0.5-mile buffer of at least one of the five Metro stations. The graph shows that a substantially smaller proportion of RB corridor residents commute using a vehicle and are more likely to use public transport or walk.
Figure 3.5: Mode of Commute in Arlington Compared to Virginia and the Entire United States, 2010-2014
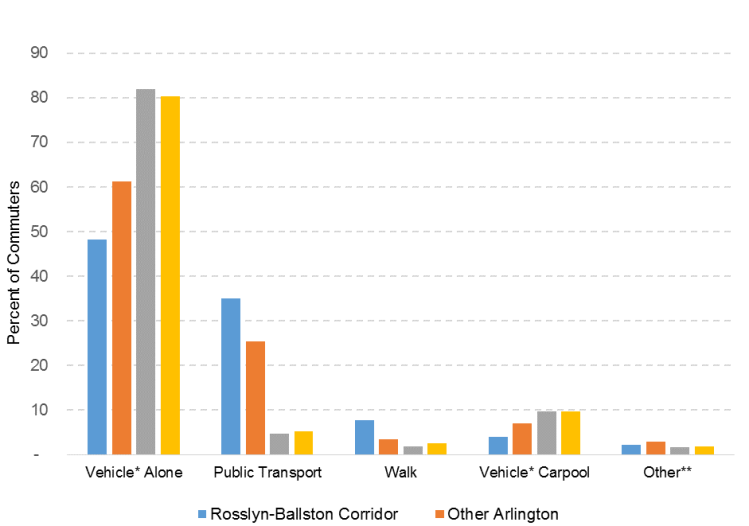
*Vehicle includes car, truck, or van **Other includes motorcycle, bicycle, taxicab, and other forms of transport
Source: analysis of U.S. Census Bureau. (2015). 2010-2014 American community survey 5-year census estimates, the graph shows the mode of commute in the RB corridor compared to the rest of Arlington, Virginia, and the U.S.
Although Figures 3.4 and 3.5 address walkability, they do not account for people who do not necessarily walk to work, but who regularly walk in the corridor nonetheless. One way to assess whether the development has led to walkable neighbourhoods is to investigate how people access each RB station. In 2007, Metro conducted a passenger survey, which included such a question. Figure 3.6 shows a sample of these results for the RB corridor compared to four other orange line stations in Virginia. The graph shows a stark contrast. The vast majority of individuals access RB stations by walking to them, while most people access the other orange line stations by an automobile. This result is consistent with the other station locations, which are in highway medians.
Figure 3.6: Mode Used to Access Orange Line Metro Stations, 2007
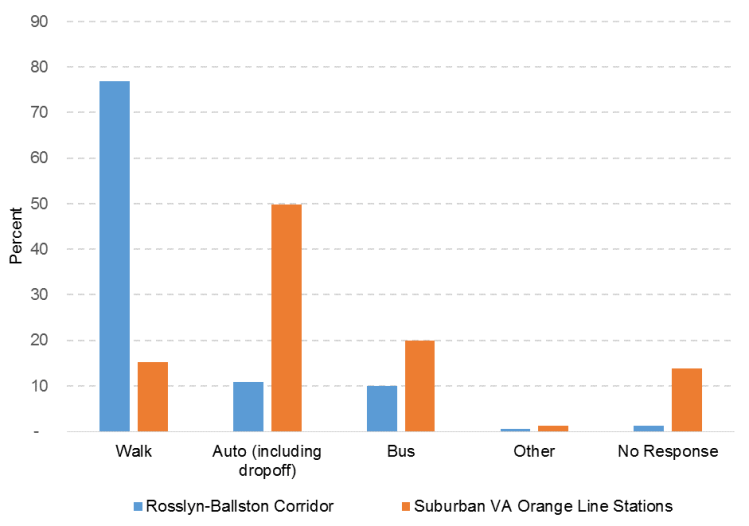
Source: adapted from Arlington County. (2012). 40 years of smart growth: Arlington County’s experience with transit oriented development in the Rosslyn-Ballston metro corridor, the graph shows that a high percentage of individuals walk to RB corridor stations compared to other orange line stations in Virginia.
Metro has not released data at the individual station level from the 2012 passenger survey, but this difference appears to hold. Overall, 71% of people accessed the 10 Arlington Metro stations by walking, compared to only 8—30% in Falls Church, Fairfax City, and Fairfax County (i.e., the jurisdictions served by the other stations) (Washington Metropolitan Area Transit Authority, 2013). As a whole, these and the other findings suggest that TOD can meaningfully affect transport choices.
4. Conclusion
From 2010—2040, Arlington expects continued growth along the corridor, including a 26% increase in residents and 36% increase in employment (Ruiz et al, 2010). As of July 2016, Arlington had already approved an additional 5.3 million square feet of office space, 420,000 square feet of retail space, and 5,500 residential units (Arlington, 2016). The county is also not resting on its laurels, with recent efforts ranging from increasingly more conventional pedestrianised and shared streets in Rosslyn to a seemingly unconventional gondola line to connect Rosslyn and Georgetown (Perry-Brown, 2016) (Stein, 2016). If implemented, the gondola would add to the variety of transport options that people along the corridor can already access instead of owning a vehicle (Figure 4.1).
Figure 4.1: Alternative Modes of Transport in the RB Corridor
| Mode | Description |
| Metrorail | Five underground metro stations serving three lines (blue, orange, and silver*) |
| Bus | 19 Metrobus routes, 12 Arlington transit routes, and one DC Circulator route |
| Capital Bikeshare | 31 stations with docks for 449 bicycles |
| Zipcar | 23 on- and off-street ‘stations’ for 43 vehicles |
| Car2Go | Smartcars that users can pick-up and park at any legal parking spot in Arlington (planned extension to existing Washington, DC Car2Go service) |
| Taxi Services | 7 tax operators licensed by Arlington |
| Carhire Services | Virginia licenses carhire services, including Uber, Lyft, and Sidecar |
| Special Buses | Two Georgetown University Shuttle Routes and Loudoun County commuter buses (Rosslyn only) |
*The silver line extension to Tysons Corner, Virginia opened in 2014, with trains passing along the original RB corridor tracks to arrive in Washington, DC.
Sources: comparison of November 2016 Zipcar, Capital Bikeshare, WMATA, ART, Loudoun County Commuter Bus, and Georgetown University Shuttle stations/routes against the Rosslyn to Ballston corridor map prepared by Arlington County; Taxi and car hire information from, Arlington County (2016e).; and Car2Go information from Siddiqui, F. (2016), this table shows the variety of options that Arlington residents, commuters, and visitors have to owning and using a private vehicle.
Unfortunately, the system that catalysed the corridor has struggled recently. After several high-profile safety incidents, Metro launched an initiative called SafeTrack this past summer that aims to rehabilitate the system (Aratani, 2016). While SafeTrack is underway, riders are encountering frequent delays, longer commute times, and closed stations (Aratani, 2016). Unless the system remerges as strong as before, the trouble could present headwinds to further growth.
One significant shortcoming for this TOD example is that metro systems are exceedingly expensive. Still, what sets Arlington apart is that the county decided seize the once-in-a-generation opportunity by committing a relatively small amount of additional funding and preparing a complementary plan to ensure Metro would have a transformational effect along the RB corridor. Arlington could have accepted stations in the median of a motorway, surrounded by parking—as did its peer in Prince Georges County, Maryland, but the county pursued TOD instead (Ross, 2014). As a result, the outcomes from Arlington’s decision provide evidence that TOD can lead to sustainable transport choices, all without sacrificing economic growth.
[1] Rosslyn also serves as a transfer point for the blue line
[2] The ratio of the floor space of a building relative to the building site, a larger number indicates higher density.
[3] Census tracts are subdivisions of counties with populations ranging from 1,200 to 8,000 people.
Bibliography
Aratani, L. (2016). ‘Ready or not, Metro’s SafeTrack maintenance surge is here’, Washington Post, June 3. Available at: https://www.washingtonpost.com/local/trafficandcommuting/ready-or-not-metros-safetrack-maintenance-surge-is-here/2016/06/03/43244f80-2908-11e6-a3c4-0724e8e24f3f_story.html?utm_term=.b5a19a20334c (accessed 6 December 2016).
Arlington County. (1961). General land use plan. Available at: https://arlingtonva.s3.dualstack.us-east-1.amazonaws.com/wp-content/uploads/sites/31/2014/02/1961-GLUP.jpg (accessed 30 November 2016).
Arlington County. (2012). 40 years of smart growth: Arlington County’s experience with transit oriented development in the Rossyln-Ballston metro corridor. Available at: https://arlingtonva.s3.amazonaws.com/wp-content/uploads/sites/31/2014/03/40_Years_Smart_Growth.pdf (accessed 18 October 2016).
Arlington County. (2014). Major planning corridors: Demographic trends. Available at: https://arlingtonva.s3.dualstack.us-east-1.amazonaws.com/wp-content/uploads/sites/31/2014/07/Major-Planning-Corridors-2008-2012-Report.pdf (accessed 13 November 2016).
Arlington County, VA. (2016a). Arlington County, Virginia – official GIS open data portal: 2013 Metro station locations. Available at: http://gisdata.arlgis.opendata.arcgis.com/datasets/1ec04543da0546d38b63d8fd8e1019d5_5 (accessed 19 November 2016).
Arlington County. (2016b). FY 2016 Arlington corridors development update: Major planning corridors. Available at: https://arlingtonva.s3.dualstack.us-east-1.amazonaws.com/wp-content/uploads/sites/31/2016/10/Development-Summary-2016-draft.pdf (accessed 13 November 2016).
Arlington County. (2016c). General land use plan map. Available at: http://gis.arlingtonva.us/Maps/Standard_Maps/Planning_Maps/GLUP.pdf (accessed 13 November 2016)
Arlington County. (2016d). Historical GLUP maps. Available at: https://projects.arlingtonva.us/plans-studies/general-land-use-plan/historical-maps/ (accessed 6 December 2016).
Arlington County. (2016e). Taxicab regulation. Available at: https://transportation.arlingtonva.us/taxis/ (accessed 13 November 2016).
Bannister, D. (1999). Planning more to travel less: Land use and transport. Town and Planning Review, 70(3), pp. 313-338.
Calthorpe, P. (1993). The next American metropolis: Ecology, community, and the American dream. New York: Princeton Architectural Press.
Calthorpe, P. (2010). Urbanism in the age of climate change. Washington, DC: Island Press.
Capital Bikeshare. (2016). Station map. Available at: https://secure.capitalbikeshare.com/map/ (accessed 13 November 2016).
City-Data. (2013). Arlington, Virginia (VA) income map, earnings map, and wages data. Available at: http://www.city-data.com/income/income-Arlington-Virginia.html (accessed 6 December 2016).
Dittmar, H., Belzer, D., and Ohland, G. (2004). ‘An introduction to transit-oriented development’. In Dittmar, H. and Ohland, G. (eds), The new transit town: Best practices in transit-oriented development. Washington, DC: Island Press, pp. 2-18.
Kraft, C. (2013). ‘When Metro came to town’, Arlington Magazine, November-December. Available at: http://www.arlingtonmagazine.com/November-December-2013/Metro/index.php?cparticle=1&siarticle=0#artanc (accessed 18 November 2016).
Leach, D. (2004). ‘The Arlington County case study: Rosslyn-Ballston corridor’. In Dittmar, H. and Ohland, G. (eds), The new transit town: Best practices in transit-oriented development. Washington, DC: Island Press, pp. 132-152.
Merchant, C. (2014). ‘As Arlington booms, traffic drops’. Greater Greater Washington, 30 June. Available at: http://greatergreaterwashington.org/post/23318/as-arlington-booms-traffic-drops/ (accessed 3 November 2016).
Montgomery, C. (2014). Happy city: Transforming our lives through urban design. New York: Penguin Books Limited.
Newman, P. and Kenworthy, J. (1999). Sustainability and cities: Overcoming automobile dependence. Washington, DC: Island Press.
Perry-Brown, N. (2016). ‘Arlington County unanimously approves care-free streets’, Urban Turf, 17 October. Available at: http://dc.urbanturf.com/articles/blog/arlington_county_board_unanimously_approves_car-free_streets/11791 (accessed 18 October 2016).
Ross, B. (2014). Dead end: Suburban sprawl and the rebirth of American urbanism. New York: Oxford University Press.
Royal Town Planning Institute. (2014). ‘Thinking spatially: Why places need to be at the heart of policy-making in the twenty-first century’, Planning Horizons no.1. Available at: http://www.rtpi.org.uk/media/1004403/rtpi_thinking_spatially.pdf (accessed 30 November 2016).
Ruiz, P., de la Barrera, A., Rodgers, E., D’huyvetter, A. (2010). ‘Growing near transit’, Arlington Planning Research Brief #8. Available at: https://arlingtonva.s3.amazonaws.com/wp-content/uploads/sites/31/2014/03/Growing-Near-Transit.pdf (accessed 13 November 2016).
Schrag, Z.M. (2014). The great society subway: A history of the Washington Metro (2nd edn). Baltimore: JHU Press.
Schwartz, S. (2015). Street smart: The rise of cities and the fall of cars. New York: PublicAffairs.
Siddiqui, F. (2016). ‘Arlington Car2Go drivers will soon be able to go into D.C.’, Washington Post, 11 May. Available at: https://www.washingtonpost.com/news/dr-gridlock/wp/2016/05/11/arlington-car2go-drivers-will-soon-be-able-to-go-into-d-c/ (accessed 13 November 2016).
Speck, J. (2012). Walkable city: How downtown can save America, one step at a time. New York: North Point Press.
Stein, P. (2016). ‘A gondola connecting D.C. and Virginia? It’s feasible and legal, study finds’, Washington Post, 3 November. Available at: https://www.washingtonpost.com/local/a-gondola-connecting-dc-and-virginia-its-feasible-and-legal-study-finds/2016/11/02/392db41a-a100-11e6-8d63-3e0a660f1f04_story.html (accessed 3 November 2016).
Sullivan, P. (2013). ‘$1 million bus stop opens in Arlington’, Washington Post, 24 March. Available at: https://www.washingtonpost.com/local/1-million-bus-stop-opens-in-arlington/2013/03/24/49e5c47e-917c-11e2-9abd-e4c5c9dc5e90_story.html?utm_term=.6589aab9a9ec (accessed 6 November 2016).
U.S. Census Bureau. (2015). 2010-2014 American community survey 5-year census estimates. Available at: http://factfinder.census.gov/faces/nav/jsf/pages/index.xhtml (accessed 19 November 2016).
United States Census Bureau. (2010). 2010 Census Tracts Cartographic Boundary Shapefiles. Available at: https://www.census.gov/geo/maps-data/data/cbf/cbf_tracts.html (accessed 19 November 2016).
Washington Metropolitan Area Transit Authority. (2013). 2012 Metrorail passenger survey. Available at: http://www.mwcog.org/asset.aspx?id=committee-documents/ZF1cV1Zb20130125141114.pdf (accessed 13 November 2016).
Weaver, S. (2011). ‘Large community case study: Rosslyn-Ballston corridor, Arlington, Virginia’, Long Island Index, January. Available at: http://www.longislandindex.org/wp-content/uploads/2015/10/Case_Study_Rosslyn-Ballston_Corridor.pdf (accessed 6 December 2016).
Weigle, E., Albert, D., Ladd, M., and Cornell, K. (2016) Adoption of comprehensive plan and zoning ordinance amendments in furtherance of the goals of the Rosslyn sector plan. Available at: http://arlington.granicus.com/MetaViewer.php?view_id=2&event_id=914&meta_id=150386 (accessed 18 October 2016).
Van Riper, T. (2014). ‘America’s richest counties 2014’, Forbes, 1 April. Available at: http://www.forbes.com/sites/tomvanriper/2014/04/01/americas-richest-counties-2014/#286c525a5120 (accessed 6 December 2016).
Zipcar. (2016). Find Zipcar car sharing locations in Washington DC. Available at: http://www.zipcar.com/find-cars/dc (accessed 13 November 2016

Discussion
Trackbacks/Pingbacks
Pingback: Robert Khodadadian - Robert Khodadadian - Commercial Observer - 13 February 2023